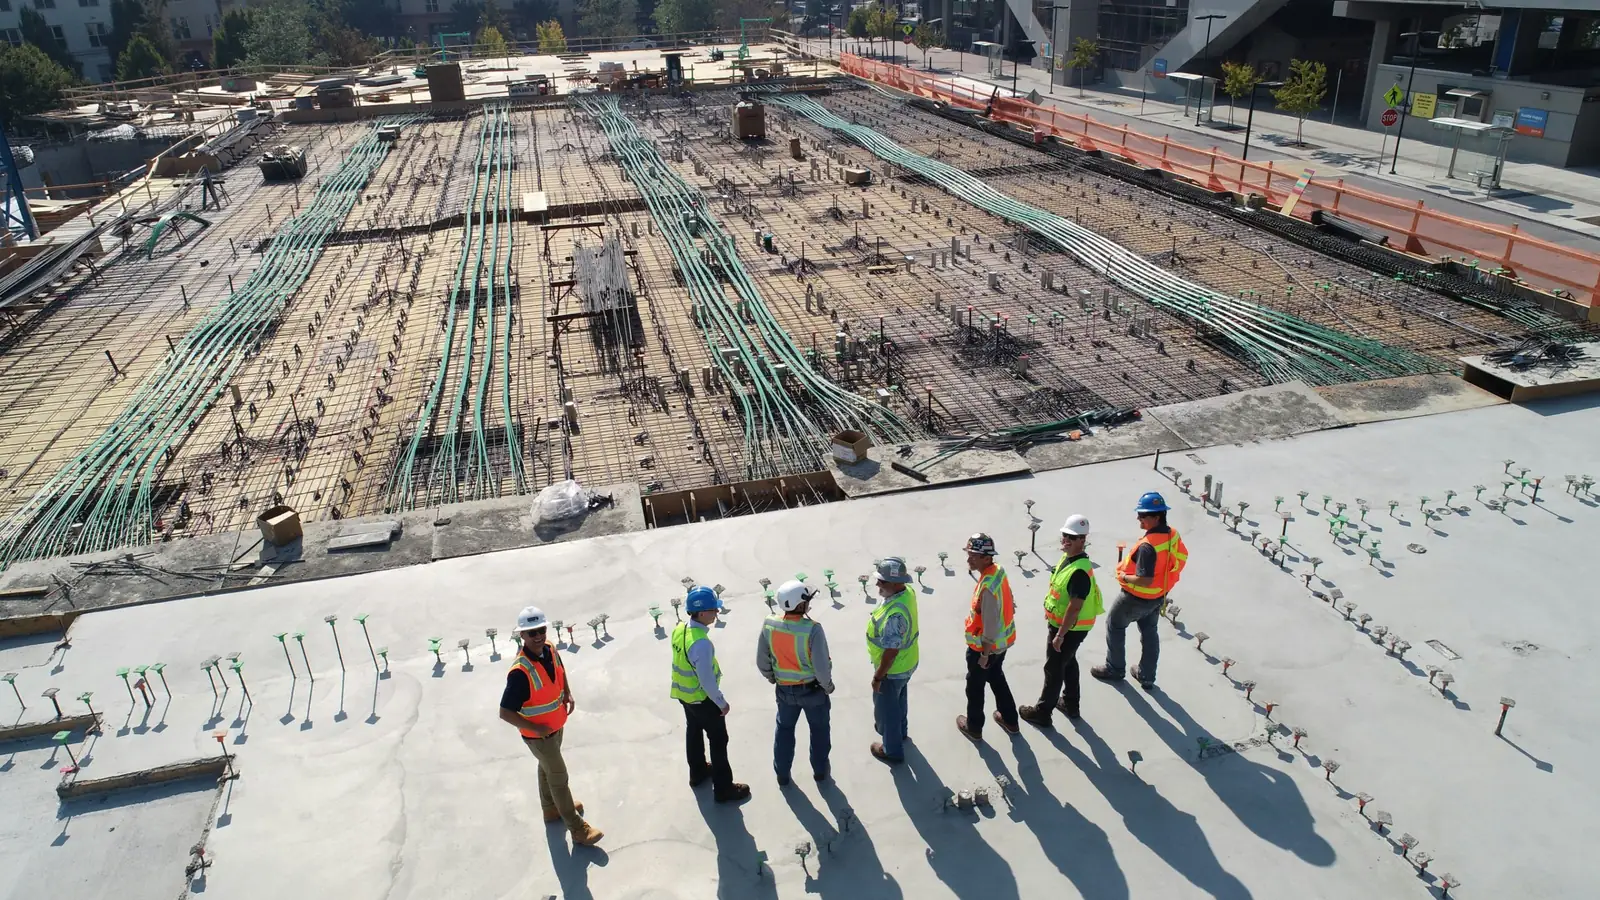
How does construction cash flow management differ from tracking profit?
Construction cash flow management tracks when cash actually moves, not when revenue is earned. A job can show profit on the schedule of values while receivables sit unpaid past the billing period, so you forecast collections, retainage releases and payables by date rather than by job completion.
Why Construction Cash Flow Management Fails Without Traceable Numbers
Most contractor cash flow problems are not margin problems. They are timing problems that surface because the underlying numbers cannot be traced back to a unit, a measurement rule and a source. A job can show a healthy markup on the schedule of values and still miss payroll in week nine, because the cash leaves on one rhythm and returns on another.
A construction cash flow forecast is only as good as the line items feeding it. If a line item says "concrete — lump sum" with no cubic yard quantity, no waste allowance and no placement rate, nobody can tell whether the billing for that line is ahead of or behind the work in place. That is how to manage cash flow for construction projects in practice: tie every dollar in and out to a measurable quantity you can re-verify.
The cash flow gap: pay-when-paid, retainage, and front-loaded costs
Direct labor, materials and general conditions are paid on a weekly or biweekly cycle. Progress billing runs on a monthly billing period, and the owner's payment terms add another 30 days after approval. Retainage of 5% to 10% is held on every pay application until substantial completion and often past the punch list, so the last dollars on the job are the slowest.
Front-loaded costs make the gap wider. Mobilization, temporary power, erosion control and the first concrete placement all land in month one, before anything is billable beyond a deposit. Your accounts payable run on net 30 from delivery; your accounts receivable run on net 30 from approval of the pay application, which is not the same date.
Profit on paper vs. cash in the bank
Cash flow versus profit in construction is a distinction between accrual and timing. Profit is what remains after committed costs and markup; cash is what is in the operating account on the 15th. A project can be 12% profitable at completion and still require a line of credit to survive the middle months.
Illustrative example: a $400,000 contract with $60,000 of front-loaded general conditions and mobilization. If the first pay application bills $90,000, retainage at 10% holds back $9,000, and the owner pays 30 days after approval, the contractor funds roughly $60,000 of cost for about 60 days before that cash returns. The profit did not change; the working capital requirement did.
Where untraceable numbers hide: unit mismatches, missing rules, and stale data
Three failure modes account for most bad forecasts. Unit mismatches: a line priced per square foot of formwork contact area but reported per square foot of floor area will drift every month. Missing rules: no stated waste allowance, no stated measurement rule for openings, no stated rounding. Stale data: a unit price set at bid time and never revisited while materials escalation moves underneath it.
The public price data shows why stale is dangerous. Producer Price Index series for steel mill products and copper wire and cable have moved far more over the recent 12 months than ready-mix concrete, so a forecast that holds every material at bid-day pricing will understate cash out on the steel and electrical packages. Re-price those lines each billing period and show the source in the workbook.
| Month | Cost incurred | Billed (work in place) | Retainage held | Cash received | Net cash position |
|---|---|---|---|---|---|
| 1 | $95,000 | $90,000 | $9,000 | $0 | -$95,000 |
| 2 | $70,000 | $85,000 | $8,500 | $81,000 | -$84,000 |
| 3 | $65,000 | $80,000 | $8,000 | $76,500 | -$72,500 |
| 4 | $60,000 | $75,000 | $7,500 | $72,000 | -$60,500 |
| 5 | $55,000 | $70,000 | $7,000 | $67,500 | -$48,000 |
| 6 (closeout) | $55,000 | $0 | $0 | $110,000 | +$7,000 |
The cash flow gap: pay-when-paid, retainage, and front-loaded costs
Pay-when-paid clauses pass the owner's payment delay down to subcontractors, so a slow approval at the top becomes a slow check at the bottom. Retainage compounds it: on a $400,000 contract at 10%, the held amount reaches $40,000 by completion, and that cash is unavailable for the entire back half of the job. Model the release date of retainage as a separate line in the forecast, not as part of the final billing.
Profit on paper vs. cash in the bank
Build the forecast from the schedule of values, not from the profit-and-loss statement. A job cost report tells you what you have spent; a billing status report tells you what you have earned. The gap between them is overbilling or underbilling, and it is the single number that most reliably predicts a cash squeeze. When billings run behind work in place, you are financing the owner.
Where untraceable numbers hide: unit mismatches, missing rules, and stale data
Write the measurement rule next to the quantity, not in a separate memo. "Cast-in-place walls: 8 in. thick, measured on vertical plane, openings under 10 sq ft not deducted" is a rule an estimator, a biller and an auditor can all apply the same way. Without it, the quantity in the draw schedule and the quantity in the takeoff will diverge and nobody will know which one is wrong.
How to Build a Construction Cash Flow Forecast That Ties to Your Schedule of Values
A forecast that does not tie to the schedule of values is a guess with columns. The schedule of values is the only document that already carries billable line items, quantities and prices in the same structure the owner will pay against. Build the cash flow from it, and every row in the forecast traces back to a line the lender, the owner and your bookkeeper can all see.
Start with a bid-ready SOV. Each line needs a CSI MasterFormat division reference, a unit of measure, a quantity, a unit price and an extension. Lines that cannot be measured — general conditions, permits, bonds, contingency — belong in their own section with a stated basis, such as months of duration times a monthly rate. Our line-item SOV build-out produces the structure a forecast can be built on.
Mapping SOV line items to project schedule activities
Every SOV line should map to at least one activity with a start and finish date. Concrete footings map to excavation, formwork, reinforcement and placement. If an SOV line spans more than one activity, split the billing curve across those activities by percentage of the line's quantity completed.
Watch for lines that cannot be scheduled: allowances, contingency and stored materials. Handle them explicitly. Stored materials are billable before installation in many contracts, but they require a bill of sale, insurance and often a site inspection, so they move cash earlier and should sit on their own forecast row.
Applying billing cycles, retainage, and payment terms
Set three dates per month: cutoff for work in place, pay application submission, and expected payment. Then apply retainage and payment terms to each. A typical arrangement is a cutoff on the 25th, submission by the 30th, approval in 10 days, payment net 30 after approval — roughly 45 to 55 days from work in place to cash.
Retainage is applied to the completed work, not to the stored materials in most contracts, so model it per line. On a $400,000 contract with 10% retainage, the maximum held is $40,000, released at substantial completion or later. If your contract allows retainage reduction to 5% at 50% completion, the release is $20,000 mid-job — a forecast line most contractors forget.
Forecasting cash in and cash out by month
Cash out follows the same activity dates, offset by vendor payment terms. Direct labor is paid weekly; materials are paid net 30 from delivery; subcontractors are paid per their subcontract, often after your receipt of payment. Build the outbound side from committed costs, not from invoices received, or you will forecast a month behind reality.
Illustrative example: a $120,000 electrical line in Division 26, billed over three months at 40%, 40% and 20%. Month 1 bills $48,000, retainage at 10% holds $4,800, and cash of $43,200 arrives in month 3. The electrician's committed cost of $96,000 is paid 30 days after your receipt, so $38,400 leaves in month 4. The line is profitable; the timing still requires working capital, which is why timing and construction profit margins are read on separate lines.
A construction cash flow statement built this way is also the document a lender wants for a construction loan draw schedule. Each draw request ties to completed activities, and each activity ties to SOV lines with quantities. Lenders approve draws against inspected work in place, so an underbilled job stalls the draw and the cash simultaneously.
| Month | Work in place billed | Retainage held | Cash received | Committed cost paid | Net cash |
|---|---|---|---|---|---|
| 1 | $48,000 | $4,800 | $0 | $0 | $0 |
| 2 | $48,000 | $4,800 | $0 | $0 | $0 |
| 3 | $24,000 | $2,400 | $43,200 | $38,400 | +$4,800 |
| 4 | $0 | $0 | $43,200 | $38,400 | +$4,800 |
| 5 | $0 | $0 | $21,600 | $19,200 | +$2,400 |
| Retainage release | $0 | -$12,000 | $12,000 | $0 | +$12,000 |
Mapping SOV line items to project schedule activities
Use the activity ID as a column in the forecast workbook. When a line spans activities, split by quantity: 4,000 sq ft of drywall hung across two activities at 60/40 becomes 2,400 sq ft and 1,600 sq ft, billed in the month each activity completes. This keeps the billing curve tied to a measurable unit rather than a percentage someone typed in.
Applying billing cycles, retainage, and payment terms
Write the terms into the workbook as parameters, not as hard-coded dates. Billing day, approval days, payment days and retainage percentage should each be a single cell the forecast references. When an owner negotiates net 45 instead of net 30, you change one cell and the whole curve shifts, which is the fastest way to see how to improve cash flow in construction through terms alone.
Forecasting cash in and cash out by month
Reconcile the forecast to the bank statement monthly. If the forecast says $180,000 should have arrived and $140,000 did, the $40,000 difference is a rejected pay application, a missing lien waiver or a disputed change order. Track that variance by cause, and the forecast becomes a management tool instead of a formality.
The Role of Project Cost Control in Construction Cash Flow Management
Cash in is driven by billing; cash out is driven by cost. A forecast that only models billing will overstate the bank balance every month. Construction cash flow management works when the outbound side is fed by the same job cost report the project team uses to run the work, with the same units, rates and sources.
Committed costs are the backbone of the outbound forecast. A signed subcontract for $96,000 is a known future outflow regardless of what has been invoiced. Track committed, invoiced and paid as three separate columns, and the difference between committed and paid is your forward cash obligation.
Tracking committed costs vs. actual costs
Committed cost is the contract value; actual cost is what has been invoiced and approved against it. The gap is cost to complete, and it belongs in the forecast by month. A subcontract at 60% complete with 45% invoiced has a timing difference, not a cost overrun, and confusing the two is how contractors misread their own cash position.
Update commitments whenever a change order is executed. An approved change order adds to both the billable SOV and the committed cost, so it should appear on both sides of the forecast in the same period. An unapproved change order is a cash risk: you are paying for the work and cannot bill it.
Using cost reports to update cash out forecasts
A job cost report organized by CSI MasterFormat division and cost code lets you roll costs into the forecast without re-keying. Each cost code carries a unit, a quantity and a unit price, so a variance is explainable: 1,200 cu yd placed against 1,150 cu yd budgeted at $145 per cu yd is a $7,250 overrun with a cause, not a mystery.
Re-forecast monthly, after the pay application is submitted and before the next billing period opens. Our project cost control and reporting service produces the cost reports that feed this step, and the schedule of values preparation team keeps the billing side aligned to the same cost codes.
Early warning signs: cost variance and cash burn rate
Two indicators matter most. Cost variance by division: if Division 03 concrete is running 8% over budget while billing is on plan, the forecast must show the overrun in the month it will be paid, not at closeout. Cash burn rate: cash out minus cash in over a rolling 30 days, compared to the line of credit available.
A retainage cash flow impact that is not modeled will look like a variance at the end of the job. Hold retainage as a receivable with an expected release date tied to substantial completion, and treat any contract clause that extends release past final payment as a financing cost. When burn rate approaches the credit line, the response is a billing acceleration or a schedule resequencing, not a new loan.
A construction cash flow projection template is only useful if the cost side updates from the same source as the billing side. Build the workbook so a single cost report refresh updates both.
| Cost code | Description | Unit | Budget qty | Actual qty | Unit price | Actual cost | Variance |
|---|---|---|---|---|---|---|---|
| 03-3000 | Cast-in-place concrete | cu yd | 1,150 | 1,200 | $145 | $174,000 | -$7,250 |
| 05-1200 | Structural steel | ton | 85 | 85 | $3,200 | $272,000 | $0 |
| 26-0500 | Feeders and branch wiring | LF | 12,000 | 9,400 | $18 | $169,200 | +$46,800 |
| 09-2900 | Gypsum board | sq ft | 42,000 | 31,500 | $2.10 | $66,150 | +$22,050 |
| 23-3113 | Ductwork | lb | 18,000 | 11,000 | $4.40 | $48,400 | +$30,800 |
Tracking committed costs vs. actual costs
Report committed, invoiced, paid and cost to complete as four columns per cost code. The sum of cost to complete across all open commitments is the minimum future cash out, before contingency. If that number exceeds the forecast's outbound total for the remaining months, the forecast is understated and the credit line is doing work the schedule should be doing.
Using cost reports to update cash out forecasts
Set the cost report cutoff the day before the billing cutoff. That way the work in place you bill and the cost you have incurred describe the same period, and overbilling or underbilling is measured against a matched set of dates. Mismatched cutoffs are the most common reason a forecast looks right in month three and wrong in month six.
Early warning signs: cost variance and cash burn rate
Watch materials escalation by division. The public producer price data shows lumber, ready-mix, steel and copper moving at very different rates over the recent 12 months, so a single escalation assumption across all divisions hides the packages that will actually hurt. Apply the published index for each material family to its own SOV lines, and show the index and date in the workbook.
Subcontractor Estimating and Its Impact on Cash Flow
On a typical commercial building, subcontract packages carry most of the direct cost, so the timing of sub invoices sets the timing of your cash out. A bid that lists a lump sum for "electrical" gives you nothing to forecast against; a bid broken into CSI MasterFormat divisions 26 and 27 with quantities, unit prices and a mobilization line lets you map cash out to the month the work actually happens.
Traceable sub bids also protect markup. If the mechanical bid is $412,000 and your estimate carried $388,000 for the same scope, the $24,000 gap is a known exposure you can price or negotiate before award, not a surprise absorbed in month four. Our subcontractor estimating services produce bid comparisons at that line-item level so the cash effect of each award is visible before you sign.
How subcontractor bids affect cash out timing
A sub's payment terms drive when money leaves your account, and terms that run longer than your own collection cycle create a gap. If a sub bills net 30 from invoice date but the owner pays your pay application 45 days after the billing period closes, you fund roughly one half-month of that sub's work from working capital. Write the sub's billing date to match your application date, and require a schedule of values at award so progress billing follows measured work rather than a percentage guess.
Retainage and payment terms in subcontracts
Back-to-back retainage is the single largest subcontractor cash lever. If the owner holds 5% on your $1,200,000 contract, that is $60,000 withheld until substantial completion and often longer through the punch list. Holding the same 5% from each sub keeps your exposure neutral; holding 10% while passing through 5% leaves you funding the difference. Confirm the release trigger in writing, and check that each sub's lien waiver matches the amount actually paid in that billing period.
Avoiding cash flow surprises from sub defaults
A defaulting sub leaves you paying twice: once for the unfinished scope and again for the replacement. Before award, compare each bid against the other bidders and against your own takeoff; a bid 18% below the next lowest on a $95,000 drywall package is a $17,100 question, not a bargain. Keep a cost to complete figure for every open subcontract, and update it at each pay application so a slow sub shows up as a forecast change rather than a month-end loss.
Construction Cash Flow Management Tools: What to Track and How
A working forecast starts with three columns per week: cash in, cash out, and the running balance. Cash in comes from the construction payment schedule you agreed at contract, including the lag between the billing period close and the actual deposit. Cash out comes from sub and supplier terms, payroll dates and the construction loan draw schedule if the project is lender-funded.
Keep the forecast at the invoice level, not the project level. A single row for "MEP sub" hides the difference between a $40,000 rough-in invoice due Friday and a $40,000 trim invoice due in six weeks. Our job cost reporting and cost control work produces the job cost report that feeds those rows with committed and actual costs.
Material price movement, Oct 2023 to Sep 2026
Key metrics: cash flow forecast accuracy, days sales outstanding, cash conversion cycle
Forecast accuracy compares what you predicted for a week against what cleared the bank; track it as a percentage and review misses by cause. Days sales outstanding measures how long receivables sit, so a net 30 contract that actually pays in 52 days carries 22 days of hidden financing. The cash conversion cycle adds inventory and work in progress days and subtracts accounts payable days; a contractor billing monthly on a 45-day cycle with 30-day sub terms is funding about 15 days of every dollar of backlog.
Simple spreadsheet vs. accounting software
A spreadsheet wins when the forecast is short, the projects are few, and you want to see the arithmetic. Accounting software wins when you need receivables aging, pay application history and job cost in one place. Either works if the forecast ties to the same schedule of values the owner approves; neither works if the forecast is rebuilt by hand each month from a different set of numbers.
Using public data for material price escalation
Escalation assumptions belong in the forecast as a named line, not folded into a contingency. The chart below rebases the Producer Price Index series for lumber and wood products, ready-mix concrete, steel mill products, and copper wire and cable to a common starting point, so you can see which inputs moved and by how much over the same window. Use the direction and spread to set a monthly escalation rate on the affected divisions, then true it against actual invoices at each billing period.
Common Construction Cash Flow Mistakes and How to Fix Them
Most contractor cash flow problems come from three habits: treating profit as cash, paying bills before collecting, and letting the forecast drift from the job cost report. Each has a traceable fix that shows up as a number on the sheet.
Ignoring retainage and holdback
A contractor books $300,000 of billed revenue on a 5% retainage contract and plans the full amount against payroll. The retained $15,000 does not arrive until final payment, so the forecast must carry it as a separate receivable with a release date tied to substantial completion and the punch list. Show retainage on every row of the construction cash flow statement, and reconcile the cumulative held amount to the AIA G702 line before you release any sub's lien waiver.
Overbilling or underbilling
Overbilling flatters profit and creates a liability you must work off; underbilling starves working capital. If 40% of a $500,000 framing package is installed but you have billed 30%, you are carrying $50,000 of unbilled work in progress. Compare earned revenue from the job cost report against billed revenue each period, and correct the next pay application rather than waiting for the change order to sort it out.
Not updating forecasts with actuals
A forecast built in January and never revised is a plan, not a forecast. At each billing period, replace projected cash in with the amount actually received and projected cash out with cleared accounts payable, then roll the balance forward. A $60,000 miss on one month's collection, carried for three months, is $180,000 of working capital the sheet never showed.
How Contractors, Owners, and Developers Can Improve Cash Flow Together
Cash leaves a job on a weekly payroll and returns on a monthly billing cycle, and that gap is the whole problem. A framing crew paid every Friday against a pay application approved 45 days later is financing the owner's building with its own working capital. Closing the construction cash flow cycle is a shared exercise: the contractor bills accurately and early, the owner reviews quickly and pays what is undisputed, and the developer's construction loan draw schedule is lined up with the billing calendar rather than trailing it. Each party controls one link, and no single party can shorten the chain alone.
Start with the contract, because payment terms are set there and rarely reopened. A billing date that falls on the 25th, a pay application due the 5th, and a 30-day review period produce a 40-day lag before the first dollar moves. Moving the billing cut-off to the 20th and the review to 15 days shortens that by more than two weeks without changing anyone's price. Owners who want predictable draws should ask for the billing calendar at buyout, not at the first invoice.
Work in progress is the number both sides should watch. When a contractor has billed 40 percent of the contract and installed 35 percent of the work, the owner is holding an underbilling that will surface as a cash squeeze later; when billed exceeds installed value, the owner is exposed to an overbilling it must recover. A joint walk each billing period, with the schedule of values line items agreed on site, keeps both numbers honest and makes the progress billing review a fifteen-minute meeting instead of a dispute.
To start, request a free quote and attach your drawings.
Related work we price the same way: construction estimate: how to calculate costs (+ example and template).
| AACE estimate class | Typical accuracy range | Base estimate | Low contingency | High contingency | Budget range (low–high) |
|---|---|---|---|---|---|
| Class 5 (concept) | −30% / +50% | $1,000,000 | $300,000 | $500,000 | $1,300,000 – $1,500,000 |
| Class 4 (study) | −20% / +30% | $1,000,000 | $200,000 | $300,000 | $1,200,000 – $1,300,000 |
| Class 3 (budget) | −15% / +20% | $1,000,000 | $150,000 | $200,000 | $1,150,000 – $1,200,000 |
| Class 2 (control) | −10% / +15% | $1,000,000 | $100,000 | $150,000 | $1,100,000 – $1,150,000 |
| Class 1 (check) | −5% / +10% | $1,000,000 | $50,000 | $100,000 | $1,050,000 – $1,100,000 |
Contingency range by estimate class
- Low contingency
- $150,000 (10%)
- High contingency
- $300,000 (20%)
- Budget range
- $1,650,000 – $1,800,000
Typical planning ranges that follow the AACE estimate-class idea: less design, more contingency. Set the final figure from a risk review of your own project.
Negotiating payment terms and billing cycles
Negotiate four numbers, not one: the billing cut-off date, the review period, the payment due date, and the retainage percentage and its release trigger. Net 30 from approval is a different term than net 30 from invoice, and the difference is often two weeks of float. Ask for retainage to step down at substantial completion and again at punch list closeout, with the release dates written into the contract rather than left to practice. On a $1,200,000 contract at 10 percent retainage, $120,000 sits outside the contractor's bank account until closeout; releasing half at substantial completion returns $60,000 roughly a quarter earlier than a single final release. Tying the schedule of values to the billing calendar is the part contractors most often leave to chance, and our schedule of values preparation work exists to make those line items match the way the job actually bills.
Using a joint schedule of values for transparency
A schedule of values agreed before the first invoice removes most pay application arguments. Each line should carry a unit, a quantity, and a price that reconciles to the contract sum, so the owner's reviewer can check 60 percent of a line item against a delivery ticket instead of arguing about a lump sum. Front-loaded values invite rejection; values that lag the work invite underbilling. Review the schedule against the cost-loaded project schedule once at buyout and again after any change order above a threshold you set, and keep the revised values signed by both parties. Our job cost reporting and cost control team produces the report that tells you whether the billed percentage is tracking the installed cost percentage.
Early warning systems and contingency planning
Set three tripwires and review them at every billing cycle: accounts receivable aging past the contractual due date, cost to complete rising above the remaining contract balance, and unbilled work in progress growing for two consecutive periods. Any one of them is a conversation; two together is a cash problem forming. Keep a line of credit sized to one billing cycle of direct labor plus general conditions, and treat it as insurance rather than working capital. Materials escalation belongs in the contingency conversation: lumber and wood products moved 8.7 percent in the 12 months to September 2026, steel mill products 27.6 percent, and copper wire and cable 30.0 percent, so a fixed-price job with no escalation clause carries real exposure. Use the calculator below to size the reserve against the estimate class you are actually working at.
Frequently Asked Questions
What is construction cash flow management?
Construction cash flow management is the practice of timing money in and money out so the bank account covers payroll, materials, and subcontractor invoices through every billing period. It works from the schedule of values, the pay application cycle, retainage withheld, and accounts payable dates. The output is a dated cash flow forecast, not a profit statement, and it is reconciled against the job cost report each month.
How do you forecast cash flow for a construction project?
Start with the schedule of values, then apply each billing period's percent complete to get progress billing amounts. Subtract retainage at the contract rate, shift receipts by the payment terms (net 30 or as agreed), and subtract accounts payable on their own due dates. Add construction loan draw timing where applicable. The result is a week-by-week cash flow projection you update as change orders and the cost to complete move.
Why is cash flow more important than profit for contractors?
Profit is an accounting result at completion; cash is what pays direct labor, materials, and general conditions this Friday. A job can show markup on paper and still fail if retainage, slow pay applications, and underbilling hold cash in work in progress. Contractors close when the cash conversion cycle outruns working capital, regardless of backlog value.
What are common causes of cash flow problems in construction?
The usual causes are retainage held past substantial completion, pay applications rejected for missing lien waivers or signed AIA G702/G703 forms, underbilling against actual cost, change orders performed before they are priced and approved, and materials escalation on items bought ahead of billing. Each one lengthens the cash conversion cycle without changing reported profit.
How can subcontractors improve their cash flow?
Bill to the schedule of values on the contract billing date, not when the invoice is convenient, and submit lien waivers with the pay application so nothing is returned. Price change orders before performing the work, track underbilling monthly against the job cost report, and negotiate retainage release at substantial completion rather than final payment. Faster, cleaner billing shortens accounts receivable more than any financing line.
What is the difference between cash flow and profit in construction?
Profit is revenue minus cost over the life of the job; cash flow is the dated movement of money in and out of the bank. They diverge because of retainage, billing lag, payment terms, overbilling and underbilling, and prepaid materials. A contractor can be profitable and still short of cash in a heavy billing month, which is why the forecast and the construction cash flow statement are read together.
Can you use my estimate template?
Send the template with the plans and we confirm whether the estimate can be delivered in it. The workbook format, unit price columns, and markup structure are reviewed during plan review, and any limits are stated in the quote before work starts.
How does a takeoff support a construction cash flow forecast?
A quantity takeoff by CSI MasterFormat division gives the units and unit prices behind each schedule of values line, so percent complete can be measured rather than estimated. That lets you bill progress against installed quantities, spot underbilling early, and tie cost to complete to real remaining scope. Send the plans and we return the takeoff in an Excel workbook with a PDF summary and marked-up drawing pages.