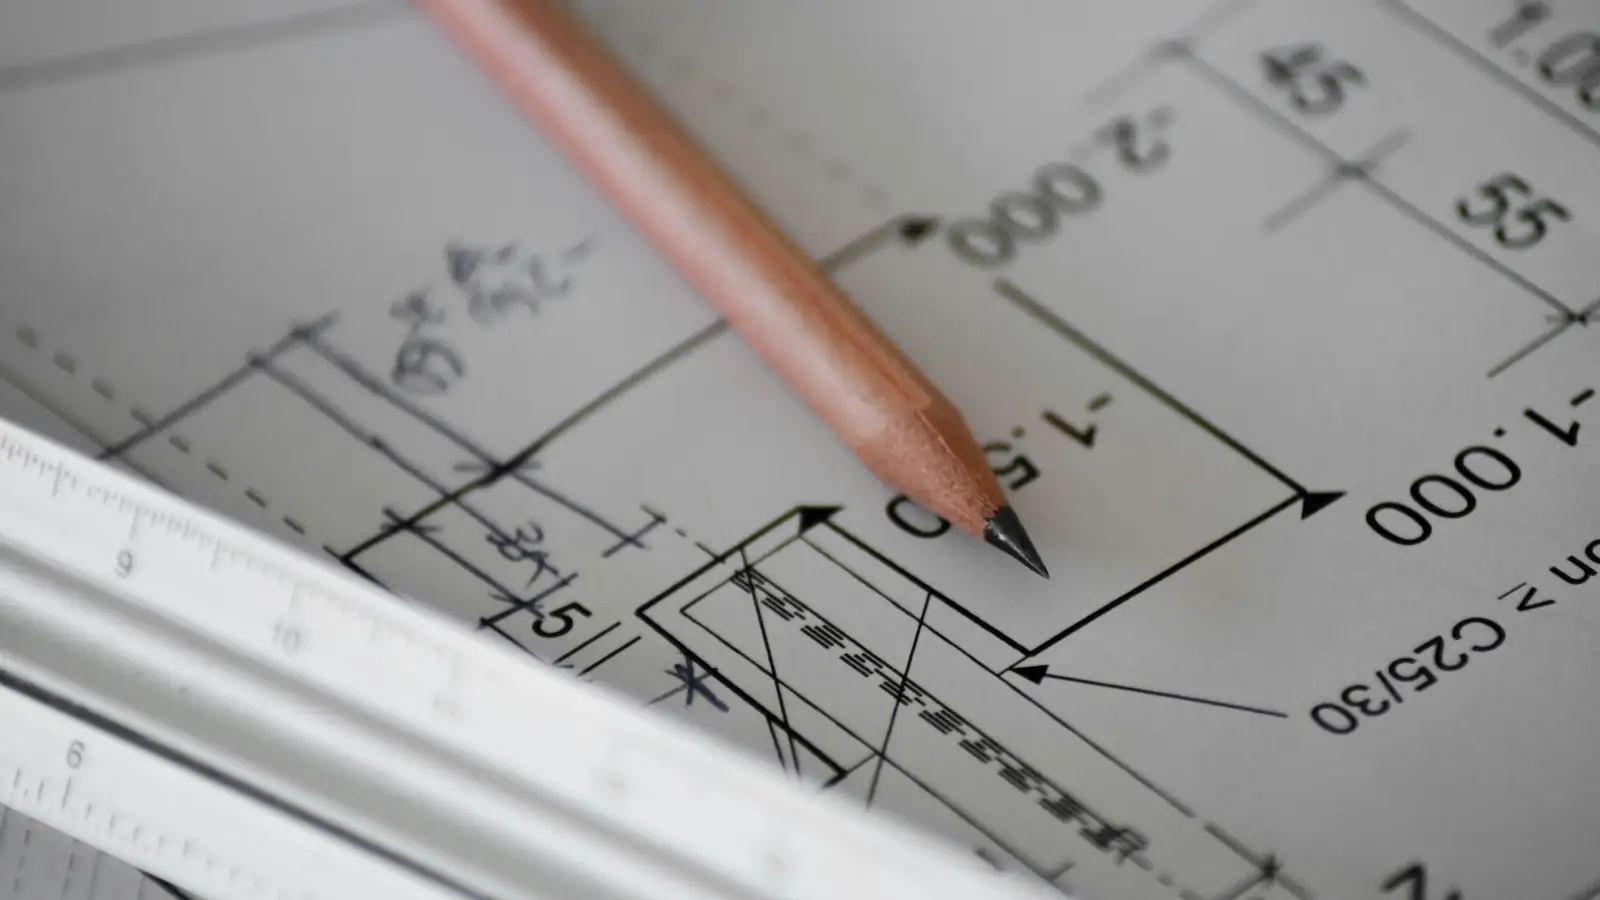
How do architectural drawings affect construction cost?
Architectural drawings affect construction cost by fixing the quantities, detail level and coordination assumptions an estimator must price. Missing dimensions, generic notes and unresolved revisions push work into contingency or change orders, so the drawing set itself drives the unit prices and labor hours in the estimate.
How Architectural Drawings Affect Construction Cost: The Chain From Line to Dollar
Every dollar on a takeoff sheet sits at the end of a chain: a drawing element, a quantity in a stated unit, a unit rate, and the arithmetic that multiplies them. A wall shown on a floor plan becomes a length in linear feet, a height from the section, a stud and finish assembly from the specification, and a square-foot area of gypsum board after subtracting openings taken from the door and window schedules. Break any link and the cost does not disappear; it moves into an allowance or a change order, where nobody can check it.
That chain is the whole story of how architectural drawings affect construction cost. The drawing decides what the estimator can count, the count decides the material quantity, and the material quantity times a priced rate decides the cost. Our position is that each of those steps should be visible on the takeoff sheet, with the unit of measure, the measurement rule applied, and the public data behind the rate. When a number cannot be traced, it is a guess wearing a decimal point.
The chain also explains why incomplete drawings construction change orders appear so reliably on projects that looked well priced at bid time. Division 01 of the CSI MasterFormat puts the rules for substitutions, allowances and clarifications in one place, and a drawing set that leaves wall types or finish scope open forces the estimator to price a placeholder. The placeholder is not wrong; it is simply unpriced information waiting to be discovered.
Where cost enters the drawing: dimensions, notes, schedules, details
A dimension string on a floor plan fixes wall lengths and room areas in square feet, so a missing dimension becomes a scaled measurement and a scaled measurement carries plan-scale error. General notes fix what the drawings do not model, such as substrate preparation or fire-rated assembly requirements, and each note that names a product pulls a priced line into the estimate. Schedules carry the highest cost per square inch on the sheet: a finish schedule assigns floor, base, wall and ceiling assemblies room by room, and one changed entry can move thousands of square feet of material.
Section details close the last gap. A wall section that shows sheathing, weather barrier, insulation, cavity depth and cladding depth lets the estimator build the assembly layer by layer rather than guess a composite rate. When the detail is absent, the estimator either asks a request for information or prices the most likely assembly and flags the assumption.
Why a number is only as good as the drawing it came from
Traceability runs in both directions. From the cost line you should be able to walk back to the takeoff sheet, then to the drawing sheet number and detail reference, then to the measurement rule that governed the count. An estimator who cannot make that walk is defending a number they cannot explain in a bid review. Read more about how we structure that trail in our drawing-based quantity takeoff service.
Drawing quality also sets the estimate class. AACE estimate classes run from order-of-magnitude through definitive, and the class is defined by the amount of project definition available, not by the calendar. A schematic set supports a coarse class with wide contingency; construction documents support a detailed class with narrow contingency. The same building can honestly carry two very different numbers, and the difference is the drawing, not the estimator. That is the practical answer to how architectural drawings affect construction cost: the sheet controls the class, the class controls the contingency, and the contingency is real money.
Where cost enters the drawing: dimensions, notes, schedules, details
A dimension string on a floor plan fixes wall lengths and room areas in square feet, so a missing dimension becomes a scaled measurement and a scaled measurement carries plan-scale error. General notes fix what the drawings do not model, such as substrate preparation or fire-rated assembly requirements, and each note that names a product pulls a priced line into the estimate. Schedules carry the highest cost per square inch on the sheet: a finish schedule assigns floor, base, wall and ceiling assemblies room by room, and one changed entry can move thousands of square feet of material.
Section details close the last gap. A wall section that shows sheathing, weather barrier, insulation, cavity depth and cladding depth lets the estimator build the assembly layer by layer rather than guess a composite rate. When the detail is absent, the estimator either asks a request for information or prices the most likely assembly and flags the assumption.
Why a number is only as good as the drawing it came from
Traceability runs in both directions. From the cost line you should be able to walk back to the takeoff sheet, then to the drawing sheet number and detail reference, then to the measurement rule that governed the count. An estimator who cannot make that walk is defending a number they cannot explain in a bid review. Read more about how we structure that trail in our drawing-based quantity takeoff service.
Drawing quality also sets the estimate class. AACE estimate classes run from order-of-magnitude through definitive, and the class is defined by the amount of project definition available, not by the calendar. A schematic set supports a coarse class with wide contingency; construction documents support a detailed class with narrow contingency. The same building can honestly carry two very different numbers, and the difference is the drawing, not the estimator.
Which Drawing Decisions Move the Number Most?
Not every line on a sheet carries the same weight. A few decisions set the magnitude of the estimate before any rate is applied, and the rest of the drawing set refines the number around them. Understanding how architectural drawings affect construction cost starts with four places where the money concentrates: building geometry, assembly selection, the completeness of schedules and details, and the coordination between disciplines.
Dimensional and grid decisions
Bay size and structural grid drive the quantity of nearly everything above and below the floor: slab area, beam and joist counts, column count, roof deck, and the length of exterior wall. A 30-foot bay and a 40-foot bay can enclose the same square footage with different steel tonnage, different foundation counts and different envelope length. Foundation quantities are measured in cubic yards of concrete and linear feet of footing, so a grid change propagates directly into both.
Story height is the second lever. Each additional foot of wall height adds wall area, exterior cladding area, stud length, and the vertical runs of mechanical, electrical and plumbing. The estimator reads height from the building section, not from a note, because the section shows whether the ceiling plane is flat, stepped or open.
Detail and specification level
The level of detail in construction documents cost is set by how far the drawings go in fixing assemblies. A wall type that names stud gauge, spacing, sheathing, insulation and finish layers can be priced from a unit price per square foot. A note that reads "gypsum board partitions per code" cannot, and the estimator must carry an allowance or a mid-range assumption. The same pattern appears in Division 09 finish scope, where a complete finish schedule supports a room-by-room count and an incomplete one supports only a lump sum.
Drawing completeness and coordination gaps
Drawing coordination errors cost estimate money in a predictable way: they land as contingency, and contingency is priced by the owner whether or not the error ever materializes. A reflected ceiling plan that disagrees with the mechanical layout on light fixture locations, or a door schedule that conflicts with the wall types, forces the estimator to choose. Division 00 and Division 01 documents should state which drawing governs in a conflict; when they do not, the estimate absorbs the ambiguity.
Addenda and revision clouds arrive after the first count and reset portions of it. Each revised sheet needs a re-takeoff of the affected scope, and the hours spent doing that are real cost even when the net quantity change is small. If you want those hours and their effect on the budget explained in your own numbers, send your plans and we will show the assumptions behind each line.
Worked Example: Two Drawing Sets, One Building, Two Costs
The following example is illustrative. It uses one rectangular single-story building, 100 feet by 60 feet, or 6,000 square feet, priced twice from two drawing sets of the same footprint. Every rate below is an illustrative assumption chosen to make the arithmetic visible; none of them is a market average, and none comes from the wage or producer price data shown elsewhere on this page.
Stated assumptions and measurement rules
Set A is a schematic floor plan at 1/8 inch per foot with a wall legend but no wall schedule, no finish schedule and no reflected ceiling plan. Set B is a full construction document set with wall types, a door and window schedule, a finish schedule, a reflected ceiling plan and section details at 3/4 inch per foot.
Measurement rules: exterior wall length is taken from the outside face, 2 × (100 + 60) = 320 linear feet. Interior partitions are scaled from the floor plan at 1.5 × the exterior wall length, giving 480 linear feet, and are assumed 9 feet high, so 480 × 9 = 4,320 square feet of partition face before openings. Gypsum board is counted on both faces, and a 10 percent waste factor is applied to board. Concrete slab is measured as 6,000 square feet at 4 inches thick, or 6,000 × 4 ÷ 12 = 2,000 cubic feet, which is 2,000 ÷ 27 = 74.07 cubic yards.
Quantities × unit rates with arithmetic shown
Set A carries allowances because the drawing does not fix the assemblies: partitions at an allowance of $9.00 per square foot of face, finishes at $6.00 per square foot of floor area, and ceilings at $3.00 per square foot of floor area. Set B prices the same scope from defined assemblies: partitions at $11.50 per square foot of face, finishes at $7.20 per square foot of floor area, and ceilings at $3.80 per square foot of floor area. The table shows the reconciliation.
The detail level changes the number in both directions. Set B costs more per unit because the drawings specify better assemblies, and it costs less in contingency because fewer questions remain open. That is the practical meaning of drawing detail level and construction cost: the drawing does not set a single price, it sets how much of the price is known. This is also the clearest way to show how architectural drawings affect construction cost without quoting a single market rate.
Reconciling the difference
Set A totals $167,443 and Set B totals $192,826, a difference of $25,383, or about 15.2 percent of Set A. Most of that gap is the higher specification in Set B, not estimator error. The honest comparison is not which set is cheaper but which set matches the intended building; a schematic set priced with allowances will drift toward the detailed cost as the design develops, and the drift is what owners experience as overrun.
Use the calculator below to apply your own assumptions to your own area: enter building area, your base hard cost per square foot, soft-cost percentage, contingency percentage and escalation percentage, and it returns hard cost, soft costs, contingency, escalation, budget total and all-in cost per square foot. It holds no prices of its own. For the counting work behind a set like Set B, see our quantity takeoff built from the drawing set, and for the budget structure around it, our guide to the budget estimate assembled before construction starts.
| Cost line | Quantity and unit | Set A rate | Set A amount | Set B rate | Set B amount |
|---|---|---|---|---|---|
| Partitions, gypsum board on both faces | 4,320 sq ft face × 2 faces × 1.10 waste = 9,504 sq ft | $9.00/sq ft | $85,536 | $11.50/sq ft | $109,296 |
| Floor finishes | 6,000 sq ft | $6.00/sq ft | $36,000 | $7.20/sq ft | $43,200 |
| Ceilings | 6,000 sq ft | $3.00/sq ft | $18,000 | $3.80/sq ft | $22,800 |
| Subtotal, three lines | — | — | $139,536 | — | $175,296 |
| Contingency on open items | Set A 20%, Set B 10% | — | $27,907 | — | $17,530 |
| Total, rounded | — | — | $167,443 | — | $192,826 |
Square-foot budget calculator
- Hard cost
- $444,000
- Soft costs
- $53,280
- Contingency
- $49,728
- Escalation
- $21,880
- Budget total
- $568,888
- All-in per sq ft
- $237
Enter your own base rate from a recent bid, cost book or estimator. The default values are placeholders for the math, not market prices.
Stated assumptions and measurement rules
Set A is a schematic floor plan at 1/8 inch per foot with a wall legend but no wall schedule, no finish schedule and no reflected ceiling plan. Set B is a full construction document set with wall types, a door and window schedule, a finish schedule, a reflected ceiling plan and section details at 3/4 inch per foot.
Measurement rules: exterior wall length is taken from the outside face, 2 × (100 + 60) = 320 linear feet. Interior partitions are scaled from the floor plan at 1.5 × the exterior wall length, giving 480 linear feet, and are assumed 9 feet high, so 480 × 9 = 4,320 square feet of partition face before openings. Gypsum board is counted on both faces, and a 10 percent waste factor is applied to board. Concrete slab is measured as 6,000 square feet at 4 inches thick, or 6,000 × 4 ÷ 12 = 2,000 cubic feet, which is 2,000 ÷ 27 = 74.07 cubic yards.
Quantities × unit rates with arithmetic shown
Set A carries allowances because the drawing does not fix the assemblies: partitions at an allowance of $9.00 per square foot of face, finishes at $6.00 per square foot of floor area, and ceilings at $3.00 per square foot of floor area. Set B prices the same scope from defined assemblies: partitions at $11.50 per square foot of face, finishes at $7.20 per square foot of floor area, and ceilings at $3.80 per square foot of floor area. The table shows the reconciliation.
The detail level changes the number in both directions. Set B costs more per unit because the drawings specify better assemblies, and it costs less in contingency because fewer questions remain open. That is the practical meaning of drawing detail level and construction cost: the drawing does not set a single price, it sets how much of the price is known. This is also the clearest way to show how architectural drawings affect construction cost without quoting a single market rate.
Reconciling the difference
Set A totals $167,443 and Set B totals $192,826, a difference of $25,383, or about 15.2 percent of Set A. Most of that gap is the higher specification in Set B, not estimator error. The honest comparison is not which set is cheaper but which set matches the intended building; a schematic set priced with allowances will drift toward the detailed cost as the design develops, and the drift is what owners experience as overrun.
Use the calculator below to apply your own assumptions to your own area: enter building area, your base hard cost per square foot, soft-cost percentage, contingency percentage and escalation percentage, and it returns hard cost, soft costs, contingency, escalation, budget total and all-in cost per square foot. It holds no prices of its own. For the counting work behind a set like Set B, see our quantity takeoff built from the drawing set, and for the budget structure around it, our guide to the budget estimate assembled before construction starts.
What Drives the Price Difference Between Drawing Sets?
Two drawing sets for the same building rarely price the same. The gap comes from how much information each set carries and how much the estimator must fill in. A set with dimension strings on every wall, elevations keyed to section details, and schedules that match the floor plan lets a quantity takeoff proceed line by line. A set that leaves dimensions to scale or omits wall types forces assumptions that later become change orders.
Design changes cost construction money in two places: the redesign itself and the rework it triggers in the field. A wall moved after framing starts carries demolition, disposal, and re-inspection that a wall moved on paper never does. As-built versus design drawings cost differs for the same reason: as-builts record what was built, design drawings describe what was intended, and pricing from design drawings requires a contingency for the gap between the two.
Contingency range by estimate class
- Low contingency
- $150,000 (10%)
- High contingency
- $300,000 (20%)
- Budget range
- $1,650,000 – $1,800,000
Typical planning ranges that follow the AACE estimate-class idea: less design, more contingency. Set the final figure from a risk review of your own project.
Detail level and documentation effort
Documentation effort scales with the number of drawn conditions. A wall schedule that lists every partition type by assembly code reduces the estimator's guesswork; a note that says "typical partitions per architect" pushes that work into the bid. The same applies to elevations: a building elevation that calls out cladding, trim, and sealant joints by material and extent can be measured directly, while a single-line elevation leaves the takeoff to inference.
More detail is not free. Drafting hours, coordination across disciplines, and review cycles all rise with the level of detail in the construction documents. The cost question is whether the added documentation removes more field uncertainty than it adds in design fees. For most projects it does, because a dimension string on paper costs less than a request for information in the field.
Revision and coordination cycles
Each revision cycle adds cost even when nothing is built. The architect redraws, the engineer rechecks, the estimator re-prices affected line items, and the schedule absorbs another review period. Addenda issued late in the bid window compress the pricing time and raise the chance that a subcontractor misses a scope item or pads the number for risk.
Coordination errors between architectural, structural, and MEP drawings are the most expensive kind because they surface after award. A beam shown on the architectural reflected ceiling plan but sized differently on the structural drawings forces a field decision, and field decisions carry labor hours at crew rates rather than drafting rates. Pricing the coordination risk explicitly, rather than hiding it in a single lump sum, keeps the estimate traceable.
Allowances and contingency created by ambiguity
When drawings are incomplete, the estimate must carry allowances for undefined scope and contingency for the unknown. The size of that contingency should track the maturity of the documents, which is what AACE estimate classes describe: a Class 5 estimate based on a program or concept carries a wider range than a Class 1 estimate based on full construction documents. The calculator below takes a base estimate and an AACE estimate class from 5 to 1 and returns a low and high contingency and the resulting budget range.
Ambiguity also creates a second cost that never appears on the contingency line: bidders price risk they cannot measure. A vague exterior elevation may attract a higher unit price for cladding than a fully detailed one, because the subcontractor covers the unknown in the rate. Resolving the drawing before bid usually costs less than the risk premium it removes. Our drawing-based quantity takeoff service is built around that principle: price what the drawings show, and flag what they do not.
How Do Drawing Revisions and RFIs Show Up in the Cost?
A revision cloud on a drawing is a cost signal. The cloud marks a change, and every change propagates through the quantity takeoff, the unit of measure for each affected line, the labor hours attached to that unit, and the schedule sequence. An estimator who prices only the new work misses the demolition, the disposal, the re-inspection, and the disruption to trades working nearby. This is one of the clearest examples of how architectural drawings affect construction cost: the drawing moves first, and the money follows.
A request for information is the same signal arriving later. The RFI itself is paperwork, but the answer changes a dimension, a material, or a detail, and that change must be priced. The discipline is to connect each RFI answer to the specific takeoff lines it touches, so the cost of the answer is visible rather than absorbed into a general conditions lump sum. Our priced estimate from construction documents documents those connections line by line.
Revision cost versus rework cost
Revision cost is the price of changing the documents before construction. Rework cost is the price of changing the building after construction has started. The two are not comparable: revision cost is mostly drafting and review hours, while rework cost includes removal, replacement, disposal, and schedule delay priced at crew rates.
Consider a wall schedule revision that changes a partition from steel stud with gypsum board to a masonry assembly. On paper, the revision changes the wall type, the fire rating, and the section detail. In the field, if the stud wall is already framed, the rework includes demolishing the framing, removing and disposing of the gypsum board, and rebuilding in masonry, plus the inspection and schedule impact. The takeoff must show the unit of measure for each: square feet of wall area removed, square feet of masonry added, and cubic yards of debris hauled. That spread between paper and field is how architectural drawings affect construction cost in practice, and it is why the timing of a revision matters as much as its content.
Documenting the change trail
Each revision should carry a number, a date, and a description that ties to the affected drawing sheets and specification sections. The estimator logs the change against the takeoff sheet, noting the original quantity, the revised quantity, and the difference. That log becomes the basis for the change order, and it keeps the arithmetic traceable when the owner asks why the number moved.
A change order that says "added $12,000 for wall changes" is not traceable. One that says "removed 480 square feet of gypsum board partition at $X per square foot, added 480 square feet of masonry at $Y per square foot, plus disposal of 6 cubic yards" can be checked. The same discipline applies to RFI answers: log the RFI number, the answer date, and the takeoff lines affected. For the budget side of that trail, see our guide to reducing construction cost overruns.
How to Read a Drawing Set for Cost Before You Price It
Read the drawing set in a fixed order so nothing is missed. Start with the general notes and the drawing index, because the notes state the assumptions that apply to every sheet. Then read the floor plans with the dimension strings, then the schedules, then the elevations and section details. Each layer answers a different pricing question, and reading them out of order invites double-counting or omission.
How drawings affect material quantities is easiest to see at the schedule level. A door schedule lists every door by type, size, and hardware set, which converts directly into a count and a unit price. A wall schedule lists partition types by assembly, which converts into square feet of each assembly. When the schedules are complete, the quantity takeoff is mostly arithmetic; when they are not, the estimator must infer quantities from the plans, and inference introduces error.
Slab quantity takeoff
- Area
- 2,400 sq ft
- Volume
- 800 cu ft
- Net concrete
- 29.63 cu yd
- Order quantity
- 31.11 cu yd
Formula: length × width × (thickness ÷ 12) ÷ 27 = cubic yards. Thickened edges, footings and pump waste are taken off separately.
Checklist: dimensions, schedules, details, notes
Work through the set with a checklist keyed to CSI MasterFormat divisions. Division 00 and Division 01 carry the general requirements and general conditions that set the rules for pricing; Division 09 carries finishes, which are usually the largest schedule-driven quantity. For each division, confirm that the drawings show the extent, the material, and the assembly.
- General notes: confirm the code editions referenced, the unit of measure conventions, and any stated allowances.
- Floor plans: check that dimension strings close and that every room has a finish callout.
- Schedules: confirm that door, window, wall, and finish schedules match the plans and are complete.
- Elevations and section details: confirm that exterior cladding, flashing, and sealant are shown by extent and material.
- Reflected ceiling plan: confirm ceiling heights, soffits, and light fixture coordination with the structural drawings.
When a dimension is missing, do not scale it silently. Mark it as an assumption on the takeoff sheet so the estimator and the reviewer can see where the number came from.
Red flags that signal allowances
Certain phrases and gaps in a drawing set reliably signal that an allowance is needed. "By others" without a scope limit, "per manufacturer" without a named product, "typical" without a type list, and "see architect's standard" all push definition out of the drawings and into the bid. Each one should trigger an allowance line with a stated basis, not a guess buried in a unit price.
Waste factor is another place where the drawings set the number. A slab shown as a simple rectangle with clean edges carries a low waste factor; an irregular slab with many penetrations carries a higher one. The calculator below turns slab length, width, thickness, and a waste percentage into area, cubic feet, net cubic yards, and an order quantity. Use it to see how a small change in the waste percentage moves the order quantity, and note that the waste percentage must come from the drawing conditions, not from habit. For the full pricing workflow after the quantities are read, see our drawing-based quantity takeoff service.
Where KNR Fits: Traceable Numbers From Your Drawings
The sections above describe how drawing decisions move money. Turning that into a bid-ready number takes a takeoff sheet where every quantity can be traced back to a sheet, a scale, and a measurement rule. That is the work we do: we read your set, measure it, and show the arithmetic so you can check any line. The fee is quoted per project after we review the plans, and the deliverable is an Excel workbook and PDF summary with marked-up drawing pages.
Our pricing starts from national average unit costs, adjusts them with published U.S. Bureau of Labor Statistics wage and Producer Price Index data, and then an estimator reviews the result. Wage data covers trades such as carpenters, electricians, and cement masons; the PPI series covers lumber and wood products, ready-mix concrete, steel mill products, and copper wire and cable. Because those indexes move, the charts on this page carry the current figures rather than a number frozen into the text.
Architect & Designer Cost Support
For design teams, the useful output is a cost read on the documents while they are still editable. We price the set as drawn, flag where a detail is too thin to measure, and return questions tied to a sheet number so the answer lands in the right place. That is the practical defense against the construction cost of design revisions: catching a missing dimension string or an unresolved wall type before it becomes an addendum. Our cost support for architects and designers work is built around that loop.
Blueprint Takeoff & Estimating
The core service is a line-item takeoff: square feet of slab and wall area, linear feet of partitions and pipe runs, cubic yards of concrete, counts from the door schedule and window schedule, and finishes measured off the floor plan and reflected ceiling plan. Each line names its unit of measure, its measurement rule, and the sheet it came from. Our priced estimate from construction documents also carries a typical waste factor where the material calls for one and a specification section reference where the spec governs the product.
Value Engineering Estimating
When the number lands above budget, we price the alternatives rather than describing them. Each option is measured with the same rules as the base takeoff, so the savings are a subtraction you can audit. A switch in wall assembly, a different glazing spec, or a revised ceiling layout gets its own line and its own delta. Pricing design alternatives against the base takeoff keeps the comparison honest because both sides use the same quantity basis. To start, send your plans and we will quote the review.
Frequently Asked Questions
How do architectural drawings affect construction cost?
They set the quantities and the labor method that every line of the estimate multiplies. A wall shown at 2x6 with continuous insulation produces different framing linear feet, sheathing square feet and crew hours than a 2x4 assembly. Understanding how architectural drawings affect construction cost means reading the plan scale, dimension strings and schedules as the source of each takeoff quantity.
Do more detailed drawings increase or decrease construction cost?
Detail level usually lowers the built cost while raising the design fee. A wall schedule with stud size, sheathing, insulation and finish lets an estimator price exact quantities and skip assumptions; a generic note forces an allowance. The trade-off is soft cost, covered in hard costs vs soft costs, against fewer change orders later.
How much does a drawing revision add to a construction estimate?
There is no fixed figure; the added cost equals the re-takeoff hours plus the material and labor delta on the affected lines. A revision cloud that moves a corridor wall changes partition linear feet, door counts and finish square feet. Each revision is priced as a delta against the prior set, so the arithmetic stays visible.
What drawing information is missing that drives up an estimate?
Common gaps are wall and finish schedules, reflected ceiling plans, door and window schedules, and specification sections that name products. Missing data becomes a stated allowance or contingency line rather than a guess folded into a unit price. Unresolved items also get listed as pre-bid questions for the design team.
Can construction cost be estimated from schematic architectural drawings?
Yes, but at a coarser AACE estimate class with wider contingency. Schematic plans support square-foot and system-level pricing, not line-by-line material takeoffs. The estimate states its class and its assumptions, and it is re-priced when construction documents and Division 00 general requirements arrive.
How do architectural drawings change material quantities in a takeoff?
Quantities come from measured geometry, not from the drawing's appearance. Partition length in linear feet, slab area in square feet and concrete in cubic yards are scaled from the plan and checked against dimension strings, then a typical waste factor is added per material. A schedule change to stud gauge or sheathing thickness alters the material quantity without changing the wall length.
Do you sign NDAs?
Clients can request one before sending drawings, and the terms are agreed before plan review begins. Send the request with the drawing set so the paperwork is settled before any takeoff work starts.
Can you use my estimate template?
Send the template along with the plans and we confirm whether the estimate can be delivered in it. The workbook structure, unit columns and summary format are reviewed against our takeoff sheet before the fee is quoted.